
Authors: Axel Rodríguez Rosa MD1, Syeda Zabreen Afzal MD2, Ary Dotiwala MD3, Lauren McCalmut MD4, Jeremy Yang MD5, George Smith MD2, Urska Cvek ScD6, Phillip Kilgore MSc6, Eric Clifford BSc6, Angela Cornelius, MD7
- Internal Medicine Department, Louisiana State University Health Shreveport
- Pediatrics Department, Louisiana State University Health Shreveport
- General Surgery Department, Louisiana State University Health Shreveport
- Obstetrics and Gynecology Department, Louisiana State University Health Shreveport
- Otolaryngology Head & Neck Surgery Department, Louisiana State University Health Shreveport
- Center for Brain Health, Louisiana State University Health Shreveport
- Emergency Medicine Department, Louisiana State University Health Shreveport
Abstract
Introduction
Risk factors associated with severe illness from COVID-19 are age, some socioeconomic factors, male sex, smoking, obesity, certain chronic medical conditions, and certain laboratory findings. In this study we analyze how age, sex, race, ethnicity, body mass index (BMI) correlate with outcomes in Louisiana.
Methods
Data was collected from COVID-19 positive patients from three medical facilities covering both North and South Louisiana. Study variables collected on patient demographics were age, gender, race, ethnicity, weight (kg), height (cm), and BMI at the time of the test. Chi-squared testing was done to identify any relationships between the different demographic and patient outcomes groupings. T-tests and one-way analysis of the variance (ANOVA) testing was used to check for relationships between specific laboratory tests and the different patient groupings, depending respectively on whether each category contained two or more than two groups.
Results
The age group of 50-54 showed the lowest association with increased mortality (OR 0.18; CI: 0.05-0.58; p < 0.001), followed by age group 55-59 (OR 0.6; CI: 0.32-1.13; p < 0.001), 65-69 (OR 0.75; CI: 0.44-1.31; p < 0.001) and finally, age group 70-74 (OR 0.81; CI: 0.43-1.52; p < 0.001). In contrast, the age groups that showed the strongest correlation with fatality rates were 60-64 (OR 0.91; CI: 0.51-1.64; p < 0.001) followed by, 85+ (OR 1.6; CI: 0.86-2.97; p < 0.001), 80-84 (OR 2.42; CI: 1.23-4.75; p < 0.001) and finally, 75-79 (OR 2.91; CI: 1.61-5.25; p < 0.001). The strongest correlation between BMI and fatality rate was noted to be in the underweight category (OR 2.34; CI: 0.93-5.87; p = 0.0346) followed by normal weight (OR 1.73; CI: 1.11-2.71), Obesity I (OR 1.01; CI: 0.63-1.63; p = 0.0346), Overweight (OR 0.88; CI: 0.55-1.41), Obesity II (OR 0.65; CI: 0.36-1.19) and finally, Obesity III (OR 0.62; CI: 0.34-1.13). A positive correlation of increased mortality on patients with a normal BMI in patients who are 65 years or older, especially those 80 years and above. Only patients between the ages of 75 and 84 years of age with a BMI of 25 – 30, showed increased mortality. The overall highest mortality was seen in patients who were 75-79 years of age with a BMI of 25 – 30. On obese patients, the highest mortality correlation was noted in patients who were 85+ years of age with a BMI of 30 – 35 followed by, ages 65-69 with a BMI of 40+ and ages 75-79 with a BMI of 30 – 35. Overall, male patients had a higher fatality rate (22.01%) when compared to females (12.6%).
Conclusions
Although the analysis in this study demonstrated an increase in mortality mainly on patients who were 75 years or older, it was also noted that an increasing prevalence of concomitant medical conditions. Males were almost twice as likely to die when compared to females, especially in populations 60 years and older. Contrary to current data, higher BMI was associated with decreasing mortality and malnutrition with the highest. Furthermore, stratification by age groups yielded increased mortality in elderly patients, despite having a normal BMI. BMI fails to adequately reflect body composition and thus, questioning its validity and use as an independent risk factor for mortality. We propose that body composition would be a better predictor of mortality. Finally, this study questions the validity of age as an independent risk factor for mortality since the increased prevalence of concomitant medical conditions with increasing age may represent a confounding factor and impact mortality.
Background
As of September 2021, the United States has reported more than 63 million COVID-19 cases. [1,2] The Centers for Disease Control and Prevention (CDC) had determined that the main risk factors for COVID-19 disease were age 65 years and older, immunosuppressed state, underlying lung and heart conditions, and diabetes mellitus. [3] Further studies have provided a better understanding of the possible risk factors associated with progression to severe disease and death. Some of the risk factors include cardiovascular disease, diabetes mellitus, hypertension, chronic lung disease, chronic obstructive pulmonary disease, cancer, chronic kidney disease, smoking, liver disease, and immunocompromising conditions. [4-12]
Since the start of the pandemic in the United States, Louisiana has more than 980,000 reported cases, [13] which is significantly less than other states, however, at the time of this study, it was the area with the fastest growing infection rate in the world. As SARS-CoV-2 spread throughout the United States, it was imperative that a thorough analysis of all the possible risk factors be performed that would not only shed understanding on whom may be at higher risk for contracting the virus but also determine what factors are more closely related to COVID-19 progression and death. In comparison to data that emerged from China,[14] Italy,[15] Spain,[16] and the United Kingdom [17] is of a more homogenous population, it’s evident that the United States population is vastly diverse in not only its demographics but also, in its health profile, compared to the before-mentioned countries. [18] Hence, this provides the opportunity to further understand how COVID-19 spreads and affects this population.
Methodology
Data sources
The data set was derived from electronic medical records in the electronic information systems at Ochsner LSU Health North Louisiana and West Jefferson Medical Center in New Orleans for 1,381 patients that tested positive for the COVID-19 test in the period of March 1, 2020, through May 31, 2020. The first reported case of COVID-19 in Louisiana was announced on March 9, 2020. Some hospitalized patients received a positive test once it was made available.
Data was collected in or near the cities of Shreveport, Monroe, and New Orleans, all of which are in the State of Louisiana and are notable for their majority-black populations in 2020. [19-21] Study variables collected on patient demographics were age, gender, race, ethnicity, weight (kg), and height (cm). Body mass index (BMI) was calculated from charted height and weight. Patient outcomes were recorded as patient survived to discharge, intubation, or deterioration in the hospital. The primary outcome assessed was survival to discharge or death. Some patients had unknown final outcomes, even though their records indicate that they were admitted or even intubated. This could be due to patient transfer or data which was unavailable at the time of analysis.
Preprocessing
The initial data contained demographic data interleaved with lab result data; this was initially separated into separate tables linked by a surrogate key so that the data remained deidentified. Several fields contained multi-valued data or multiple representations of the same value. To address this, we curated all values in these fields and determined appropriate replacements for them, which were then applied in-situ. We also normalized the data at this step by trimming extraneous whitespace and converting any “Yes” and “No” values into Boolean data. In total, we received records of 1,421. Patients younger than 18 were excluded from our analysis and 40 patients were removed due to missing or invalid data, yielding 1,381 or 97.2% of the original data set.
To address extreme outliers, each respective variable was filtered to exclude values higher and/or lower than three standard deviations from the mean. For each variable, descriptive statistics were calculated for each group of patient outcomes. Special attention was paid to the groups-wise medians for each respective variable. BMI values over 185.5 and values under 10 were omitted, being considered highly unlikely/impossible. The following fields were inspected for compliance with the ranges in Table 1.
Table 1. Minimum and maximum variable for each analyzed variable
| Variable | Minimum | Maximum |
| Weight | 2.1 | 194.4 |
| Height | 54.6 | 267 |
| BMI | 7.5 | 185.5 |
Statistical Analysis
Chi-squared testing was done to identify any relationships between the different demographic and patient outcomes groupings. T-tests and one-way analysis of the variance (ANOVA) testing was used to check for relationships between specific laboratory tests and the different patient groupings, depending respectively on whether each category contained two or more than two groups.
Prior to any statistical analysis, the domain of each variable was characterized within the data. For numeric data, the mean, limits, standard deviation, number of records defined, and normality of that variable were determined. Normality was determined using the Anderson-Darling normality test for α=0.1. For categorical data, proportions for each value associated with the variable were determined. Distribution plots were generated for each domain.
To determine which numeric variables contributed to the variance in the data, principal components analysis (PCA) was performed. Analysis was performed from two major perspectives: with respect to patient demographics and laboratory results. In addition to an overview, comparison of demographics to conditions and the combination of demographics and conditions with outcomes were made.
Results
Age Demographics
There was a total of 1,381 patients (99.28%) who were between 18 and 98 years old whereas, 10 patients (0.72%) were excluded from the analysis because of no age being recorded. Mean age was 53.39 years old with a median age of 55 years old. Patients were grouped and distributed according to NIH Age Classes, as detailed in Table 2.
Table 2. Number of patients by NIH Age Group.
| Age Range | Count (%) |
| 18 – 19 | 18 (1.30) |
| 20 – 24 | 57 (4.13) |
| 25 – 29 | 97 (7.02) |
| 30 – 34 | 82 (5.94) |
| 35 – 39 | 96 (6.95) |
| 40 – 44 | 113 (8.18) |
| 45 – 49 | 107 (7.75) |
| 50 – 54 | 112 (8.11) |
| 55 – 59 | 160 (11.59) |
| 60 – 64 | 138 (9.99) |
| 65 – 69 | 138 (9.99) |
| 70 – 74 | 92 (6.66) |
| 75 – 79 | 67 (4.85) |
| 80 – 84 | 47 (3.40) |
| 85 – 89 | 31 (2.24) |
| 90 – 94 | 18 (1.30) |
| 95 – 99 | 8 (0.58) |
Fatality Rate of COVID-19 by Age Group
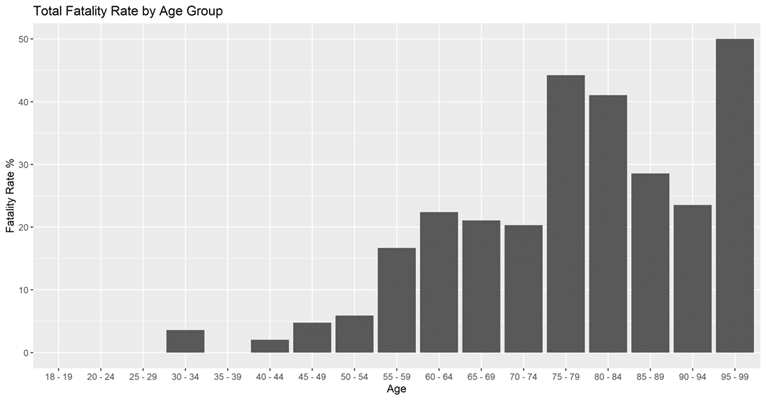
From the 1,381 patients, only 736 of them (53.29%) had an outcome that could be interpreted as survival to discharge or death, while the rest were excluded due to an ongoing hospital course and an unknown disposition at the time of data collection. Looking at the fatality rate among patients by age, there is a clear association between fatality rate and age that was significant (p < 0.001). There were no recorded deaths in patients 18 to 49 years of age with exception of, one death each in the age ranges 30-34 and 40-44 and two deaths in the age category of 45-49. In contrast, data showed a near linear correlation between increasing fatality rate and increasing age for patients of 50 years of age and above. The age group of 50-54 showed the lowest association with increased mortality (OR 0.18; CI: 0.05-0.58; p < 0.001), followed by age group 55-59 (OR 0.6; CI: 0.32-1.13; p < 0.001), 65-69 (OR 0.75; CI: 0.44-1.31; p < 0.001) and finally, age group 70-74 (OR 0.81; CI: 0.43-1.52; p < 0.001). In contrast, the age groups that showed the strongest correlation with fatality rates were 60-64 (OR 0.91; CI: 0.51-1.64; p < 0.001) followed by, 85+ (OR 1.6; CI: 0.86-2.97; p < 0.001), 80-84 (OR 2.42; CI: 1.23-4.75; p < 0.001) and finally, 75-79 (OR 2.91; CI: 1.61-5.25; p < 0.001). Figure 1 depicts these trends.
Figure 1. Fatality Rate of COVID-19 Patients by NIH Age Group
BMI Demographics
The patients have varying BMI values ranging from 0.35 to 607.97, which included invalid values. BMI values over 185.5 and values under 10 were omitted, being considered highly unlikely/impossible. These values are direct results of highly improbable heights and weights for the given patients. Among the new set of patients with reasonable BMIs, the mean BMI is 32.3 and the median BMI is 31.1. The patients were grouped into BMI classes according to NIH BMI ranges, detailed in Table 4, along with a breakdown of patient counts by BMI. The average BMI fell into the “Obese I” category, while the group with the most patients is “Overweight.” Very few patients were noted to be underweight.
Table 4. COVID-19 Patient Count and fatality rate by BMI Group
| Category | BMI Range | Count (%) | Death Count (%) | Discharge Count (%) | Fatality Rate (%) |
| Underweight | 0 – 18.4 | 26 (1.88) | 7 (5.74) | 14 (2.37) | 33.33 |
| Normal Weight | 18.5 – 24.9 | 234 (16.94) | 34 (27.87) | 107 (18.10) | 24.11 |
| Overweight | 25 – 29.9 | 310 (22.44) | 27 (22.13) | 144 (24.37) | 15.80 |
| Obese I | 30 – 34.9 | 301 (21.80) | 26 (21.31) | 125 (21.15) | 17.22 |
| Obese II | 35 – 39.9 | 207 (14.99) | 14 (11.48) | 99 (16.75) | 12.39 |
| Obese III | 40+ | 212 (15.35) | 14 (11.48) | 102 (17.26) | 12.07 |
Fatality rate of COVID-19 by BMI group
The association between death and BMI group was significant (p=0.0346). Table 4 indicates that as patient BMI increases, fatality rate for these patients decreases. When analyzing the fatality rate in relation to BMI, the association between death and all BMI groups were statistically significant (p=0.0346). Although it is worth noting that the “Underweight” category was the category with the least subjects, it accounted for the highest fatality rate (33.33%).
The strongest correlation between BMI and fatality rate was noted to be in the underweight category (OR 2.34; CI: 0.93-5.87; p = 0.0346) followed by normal weight (OR 1.73; CI: 1.11-2.71), Obesity I (OR 1.01; CI: 0.63-1.63; p = 0.0346), Overweight (OR 0.88; CI: 0.55-1.41), Obesity II (OR 0.65; CI: 0.36-1.19) and finally, Obesity III (OR 0.62; CI: 0.34-1.13). Conversely, the inverse relationship was noted to be true for survival when comparing with BMI, most notably on Obesity III class (OR 1.61; CI: 0.88-2.91). It is worth noting that only 21 patients with outcomes fall into the “0 – 18.4” range. In addition, of note is that BMI seems to slightly decrease as age increases.
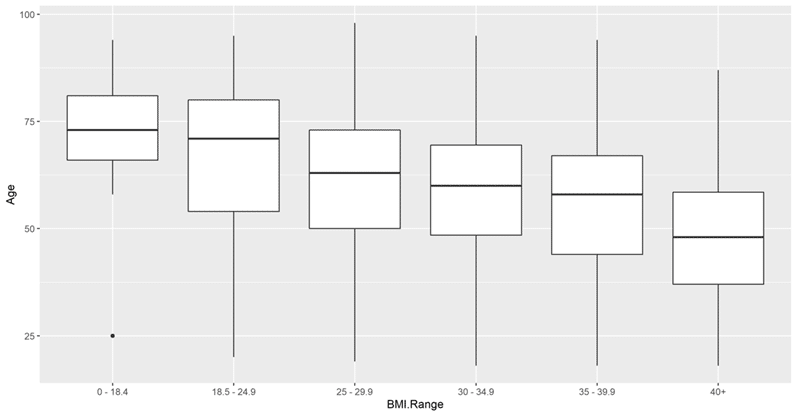
BMI Groups stratified by age – Demographics
Figure 3 displays BMI values by Age group, for those patients who had a Hospital Disposition of either “Death” or “Discharge.” Our data showed that only patients who were 65 years of age or older had a BMI of <18.5, which suggests that older patients are more likely to be malnourished whereas, patients tended to be younger as BMI increases. When overall comparing BMI versus age group it was found to be not statistically significant (p=0.103) however, this may have been possibly due to the small numbers in each of the more than 40 stratified groups. When analyzed per age group, only three groups were considered significantly different: 65-69, 70-74, and 75-79 (p=0.0328). This is likely because these were the only groups which had at least 3 patients in each BMI category per age group. The trend seems to be hold true for these statistically significant groups, with the patients of ages 65-69 being more likely to have a BMI of 40+ (OR 2.1; CI: 0.85-5.19; p = 0.0328). In contrast, when compared to the age range of 65-69, the patients in the age groups of 70-74 (OR 1.64; CI: 0.5-5.31; p = 0.0328) and 75-79 (OR 1.17; CI: 0.31-4.44; p = 0.0328) were more likely to have a BMI of <18.5 and 18.5 – 25, respectively.
Figure 3. Age group distribution of COVID-19 Patients by BMI range
When analyzing the fatality rate by BMI group, the association between death and BMI group was statistically significant (p=0.0346). As depicted on Table 5, BMI <18.5 was associated with the highest mortality overall. In addition, an evident trend is seen of decreasing mortality, as BMI increases.
Table 5. COVID-19 fatality rate Odds Ratio comparison in patients by BMI groups
| BMI Class | OR | CI |
| <18.5 | 2.34 | 0.93 – 5.87 |
| 18.5 to 25 | 1.73 | 1.11 – 2.71 |
| 25 to 30 | 0.88 | 0.55 – 1.41 |
| 30 to 35 | 1.01 | 0.63 – 1.63 |
| 35 to 40 | 0.65 | 0.36 – 1.19 |
| 40+ | 0.62 | 0.34 – 1.13 |
When analyzing the fatality rate of patients by BMI group stratified by age, the global test was not significant (p=0.432), most likely due to the low counts due to combinatorial explosion. Many values failed to meet the minimum of 3 instances in one or the other cohorts. For those groups that met this criterion, the fatality rate odds ratio was calculated, as depicted on Table 6. A positive correlation of increased mortality on patients with a normal BMI in patients who are 65 years or older, especially those 80 years and above. In addition, only patients between the ages of 75 and 84 years of age with a BMI of 25 – 30, showed increased mortality. The overall highest mortality was seen in patients who were 75-79 years of age with a BMI of 25 – 30. On obese patients, the highest mortality correlation was noted in patients who were 85+ years of age with a BMI of 30 – 35 followed by, ages 65-69 with a BMI of 40+ and ages 75-79 with a BMI of 30 – 35. The rest showed little to no correlation with increased mortality regardless of BMI or age range.
Table 6. COVID-19 fatality rate Odds Ratio comparison in patients by BMI, stratified by age groups
| BMI:Age Group | OR | CI |
| 18.5-25:65-69 | 1.15 | 0.39 – 3.42 |
| 18.5-25:70-74 | 1.12 | 0.34 – 3.75 |
| 18.5-25:75-79 | 1.08 | 0.4 – 2.92 |
| 18.5-25:80-84 | 1.85 | 0.57 – 5.98 |
| 18.5-25:85+ | 1.77 | 0.76 – 4.1 |
| 25-30:55-59 | 0.76 | 0.24 – 2.41 |
| 25-30:60-64 | 0.4 | 0.11 – 1.39 |
| 25-30:65-69 | 0.36 | 0.1 – 1.23 |
| 25-30:75-79 | 3.17 | 0.94 – 10.66 |
| 25-30:80-84 | 1.73 | 0.6 – 5.01 |
| 30-35:55-59 | 0.72 | 0.26 – 2.03 |
| 30-35:60-64 | 1.4 | 0.5 – 3.91 |
| 30-35:65-69 | 0.36 | 0.1 – 1.23 |
| 30-35:70-74 | 0.61 | 0.2 – 1.88 |
| 30-35:75-79 | 1.27 | 0.31 – 5.18 |
| 30-35:85+ | 2.57 | 0.51 – 12.96 |
| 35-40:60-64 | 1.01 | 0.31 – 3.3 |
| 35-40:70-74 | 0.94 | 0.24 – 3.64 |
| 40+:65-69 | 1.46 | 0.42 – 5.11 |
Demographics – Gender
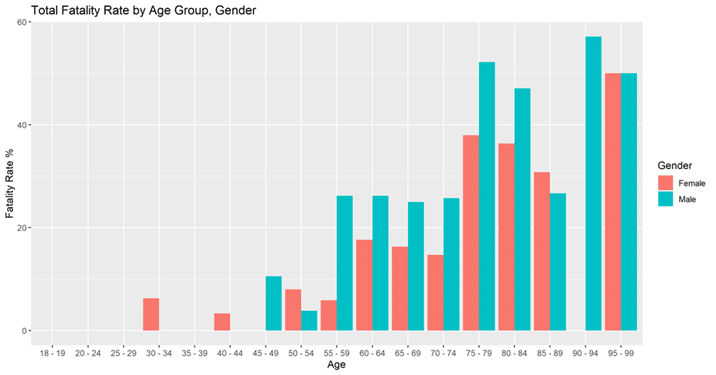
Gender distribution was 790 female patients (55.8%), 613 male patients (43.3%), and 12 patients without gender designation (0.8%). Given the small number of patients with no gender designation, we focused on known male and female patients. Overall, male patients had a higher fatality rate (22.01%) when compared to females (12.6%), as shown in Table 7. Our analysis showed that the association between fatality and gender-age pair was statistically significant (p=0.0151). The same trend holds true for most age groups when looking at age group and gender, as displayed in Figure 4. In addition, this pattern held true when stratifying patients by gender and race, when comparing fatality rates. This tendency is further supported by the OR being consistently higher in males when compared to females. In addition, although females 75 years of age or older were more affected than younger females, males consistently showed higher OR when compared to females in the same categories, as depicted on Table 8.
Table 7. Fatality Rate and Outcome Counts of COVID-19 Patients by Gender
| Gender | Death | Discharge | Fatality Rate (%) |
| Female | 49 | 340 | 12.60 |
| Male | 79 | 280 | 22.01 |
Table 8: COVID-19 fatality rate Odds Ratio comparison in patients by gender, stratified by age groups
| Female | Male | ||||
| Age Group | OR | CI | Age Group | OR | CI |
| 60-64 | 0.54 | 0.22 – 1.35 | 60-64 | 0.93 | 0.45 – 1.92 |
| 65-69 | 0.39 | 0.16 – 0.94 | 65-69 | 0.87 | 0.44 – 1.69 |
| 70-74 | 0.43 | 0.16 – 1.14 | 70-74 | 0.95 | 0.43 – 2.09 |
| 75-79 | 1.68 | 0.77 – 3.67 | 75-79 | 3.09 | 1.33 – 7.22 |
| 80-84 | 1.55 | 0.63 – 3.79 | 80-84 | 2.45 | 0.92 – 6.5 |
| 85+ | 0.74 | 0.29 – 1.89 | 85+ | 2.03 | 0.91 – 4.57 |
Figure 4. Gender and Age Group Fatality Rate
Discussion
Since the beginning of the COVID-19 pandemic, elucidating the SARS-CoV-2 intricacies has been a global challenge. This is due in part to its rapid spread and novel mutations. Initial data suggested numerous risk factors associated with increased severity of disease and fatality rates including, Age, BMI, and gender as some of the significant demographic variables. However, as we have come to learn more about COVID-19, data seems to suggest that not all these factors are independently related to poor outcomes or increased mortality.
In line with previously published results, infected elderly patients are at a higher risk of death when compared to younger patients. [4, 22-25] This association between death and age group was significant (p < 0.001) and was most notably associated in patients who were 75 years or older. It is worth noting that in our analysis, there was noted to be a larger prevalence of concomitant chronic medical conditions as age increased, which may be contributing to the increased dangers associated with COVID-19 infection.
In a similar study, Yoshida et al. analyzed 776 patients in the city of New Orleans and found that the fatality rates among men and women were similar, [26] contrary to prior studies from China, Europe, and United States. [24,27-30] In contrast, our study found that despite a gender distribution of majority females, males showed almost double the fatality rate when compared to females, especially in populations 60 years and older.
Another risk factor that studies have shown to be associated with increased mortality is BMI, specifically obesity classes (BMI >29.9), especially those younger than 60 years of age. [31-36] In contrast, other studies have shown that those with a BMI of < 28.9 and those with a BMI > 39 had a higher risk of mortality than those with a BMI ranging from 29 to 39, suggesting the presence of a possible “obesity paradox.” [37] This concept suggests that obesity may confer some survival advantage in the surviving clinical subpopulations such as in patients with chronic heart failure, hypertension, peripheral arterial disease, Diabetes Mellitus type 2, and chronic kidney disease. [38-39] Although numerous studies refute the existence of an “obesity paradox” in relation to COVID-19 infection, [36,40-41] our study not only showed that mortality decreased as BMI increased but also, it suggests that BMI <18.5 conferred the highest mortality. It is worth noting however, that only 21 patients with outcomes fall into the “0 – 18.4” range, hindering further analysis when stratified by age range, depicting a limitation of this study. In addition, the global test when analyzing the COVID-19 fatality rate by BMI group stratified by age, was not statistically significant (p=0.432), likely due to the low counts due to combinatorial explosion. However, an increased association with mortality was still present in patients of ages 65 years or older who had a BMI of 18.5 – 25. In addition, although the strongest mortality correlation was seen in specific age groups in obese patients, these were mainly observed in those who were 75 years or older. Thus, due to the higher prevalence of concomitant medical conditions in this population, it raises the question against the validity of age and BMI as sole independent risk factors for increased mortality. This argument is further supported not only by our findings of decreasing mortality with increasing BMI but also, by the increased mortality association in all age groups above 65 years of age, despite a normal BMI.
There is one significant limitation that many of the initial BMI-related studies had. Although these studies showed that increasing BMI is a risk factor for increasing mortality and disease severity regarding COVID-19 infection, many of these did not include BMI < 18.5. Similar to our study results, when taking into consideration the malnourished population, studies have shown an increase in mortality, demonstrating a J-shaped graph. [42] This is an important aspect to consider since not only has this same relationship been noted in adults and children in influenza, H1N1, and other viral respiratory illnesses, [43-45] and ARDS (Acute Respiratory Distress Syndrome) [46] but also, most recently, COVID-19. [47] Raising again the question of, in fact, BMI itself is an independent risk factor. BMI is the resulting value of a formula that only takes into consideration an individual’s height and weight, however, does not account for body composition. Therefore, we propose that BMI is not necessarily an accurate tool to measure mortality, as BMI >24.9 is not representative of adiposity, especially in populations like athletes, military, or bodybuilders.
Conclusion
Numerous studies have demonstrated how age impacts outcomes in patients with COVID-19. Although the analysis in this study demonstrated an increase in mortality mainly on patients who were 75 years or older, in line with previously published data, it was also noted that an increasing prevalence of concomitant medical conditions. In addition, males were almost twice as likely to die from COVID-19 when compared to females, especially in populations 60 years and older. Contrary to current data, higher BMI was associated with decreasing mortality and malnutrition with the highest. Furthermore, stratification by age groups yielded increased mortality in elderly patients, despite having a normal BMI.
Despite being a widely used tool, BMI fails to adequately reflect body composition and thus, questioning its validity and use as an independent risk factor for mortality. As inferred by this study, nutrition significantly impacts mortality in COVID-19 and an individual’s ability to recover. Hence, we propose that body composition would, in turn, be a better predictor of mortality. Finally, this study questions the validity of age as an independent risk factor for mortality since the increased prevalence of concomitant medical conditions with increasing age may represent a confounding factor and impact mortality.
One of the most significant limitations in this study was the lack of power as this hindered further subgroup stratified analysis. For this reason, additional studies with larger patient samples are required to further elucidate the influence of multiple factors regarding mortality.
References
- “COVID-19 Map.” Johns Hopkins Coronavirus Resource Center, coronavirus.jhu.edu/map.html.
- CDC. “COVID Data Tracker.” Centers for Disease Control and Prevention, 28 Mar. 2020, covid.cdc.gov/covid-data-tracker/#demographicsovertime.
- “Underlying Medical Conditions Associated with High Risk for Severe COVID-19: Information for Healthcare Providers.” Centers for Disease Control and Prevention, 11 Feb. 2020, www.cdc.gov/coronavirus/2019-ncov/hcp/clinical-care/underlyingconditions.html.
- Zhou, Fei, et al. “Clinical Course and Risk Factors for Mortality of Adult Inpatients with COVID-19 in Wuhan, China: a Retrospective Cohort Study.” The Lancet, vol. 395, no. 10229, 9 Mar. 2020, pp. 1054–1062., doi:10.1016/s0140-6736(20)30566-3.
- Wu, Chaomin, et al. “Risk Factors Associated With Acute Respiratory Distress Syndrome and Death in Patients With Coronavirus Disease 2019 Pneumonia in Wuhan, China.” JAMA Internal Medicine, 13 Mar. 2020, doi:10.1001/jamainternmed.2020.0994.
- Grasselli, Giacomo, et al. “Baseline Characteristics and Outcomes of 1591 Patients Infected With SARS-CoV-2 Admitted to ICUs of the Lombardy Region, Italy.” Jama, 6 Apr. 2020, doi:10.1001/jama.2020.5394.
- Jordan, Rachel E, et al. “Covid-19: Risk Factors for Severe Disease and Death.” Bmj, 26 Mar. 2020, p. m1198., doi:10.1136/bmj.m1198.
- Bhatraju, Pavan K., et al. “Covid-19 in Critically Ill Patients in the Seattle Region — Case Series.” New England Journal of Medicine, 30 Mar. 2020, doi:10.1056/nejmoa2004500.
- Arentz, Matt, et al. “Characteristics and Outcomes of 21 Critically Ill Patients With COVID-19 in Washington State.” Jama, 19 Mar. 2020, doi:10.1001/jama.2020.4326.
- “Preliminary Estimates of the Prevalence of Selected Underlying Health Conditions Among Patients with Coronavirus Disease 2019 – United States, February 12–March 28, 2020.” Centers for Disease Control and Prevention, Centers for Disease Control and Prevention, 31 Mar. 2020, www.cdc.gov/mmwr/volumes/69/wr/mm6913e2.htm.
- Zhou, Yulong, et al. “Risk Factors Associated with Disease Progression in a Cohort of Patients Infected with the 2019 Novel Coronavirus.” Annals of Palliative Medicine, vol. 9, no. 2, 22 Mar. 2020, pp. 428–436., doi:10.21037/apm.2020.03.26.
- Chen, Tao, et al. “Clinical Characteristics of 113 Deceased Patients with Coronavirus Disease 2019: Retrospective Study.” Bmj, 26 Mar. 2020, p. m1091., doi:10.1136/bmj.m1091.
- “Coronavirus (COVID-19): Department of Health: State of Louisiana.” Coronavirus (COVID-19) | Department of Health | State of Louisiana, ldh.la.gov/Coronavirus/.
- “The World Factbook: China.” Central Intelligence Agency, Central Intelligence Agency, 1 Feb. 2018, www.cia.gov/library/publications/the-world-factbook/geos/ch.html.
- “The World Factbook: Italy.” Central Intelligence Agency, Central Intelligence Agency, 1 Feb. 2018, www.cia.gov/library/publications/the-world-factbook/geos/it.html.
- “The World Factbook: Spain.” Central Intelligence Agency, Central Intelligence Agency, 1 Feb. 2018, www.cia.gov/library/publications/the-world-factbook/geos/sp.html.
- “The World Factbook: United Kingdom.” Central Intelligence Agency, Central Intelligence Agency, 1 Feb. 2018, www.cia.gov/library/publications/the-world-factbook/geos/uk.html.
- “The World Factbook: United States.” Central Intelligence Agency, Central Intelligence Agency, 1 Feb. 2018, www.cia.gov/library/publications/the-world-factbook/geos/us.html.
- “U.S. Census Bureau QuickFacts: Shreveport City, Louisiana.” Census Bureau QuickFacts, 2021, www.census.gov/quickfacts/shreveportcitylouisiana.
- “U.S. Census Bureau QuickFacts: Monroe City, Louisiana.” Census Bureau QuickFacts, 2021, www.census.gov/quickfacts/fact/table/monroecitylouisiana/PST045219.
- “U.S. Census Bureau QuickFacts: New Orleans City, Louisiana.” Census Bureau QuickFacts, 2021, www.census.gov/quickfacts/neworleanscitylouisiana?sec_ak_reference=18.79c1cb8.1569151844.7495147.
- Chen, Nanshan, et al. “Epidemiological and Clinical Characteristics of 99 Cases of 2019 Novel Coronavirus Pneumonia in Wuhan, China: A Descriptive Study.” The Lancet, vol. 395, no. 10223, 2020, pp. 507–13. Crossref, doi:10.1016/s0140-6736(20)30211-7.
- Wu, Zunyou, and Jennifer M. McGoogan. “Characteristics of and Important Lessons From the Coronavirus Disease 2019 (COVID-19) Outbreak in China.” JAMA, vol. 323, no. 13, 2020, p. 1239. Crossref, doi:10.1001/jama.2020.2648.
- Richardson, Safiya, et al. “Presenting Characteristics, Comorbidities, and Outcomes Among 5700 Patients Hospitalized With COVID-19 in the New York City Area.” JAMA, vol. 323, no. 20, 2020, p. 2052. Crossref, doi:10.1001/jama.2020.6775.
- Onder, Graziano, et al. “Case-Fatality Rate and Characteristics of Patients Dying in Relation to COVID-19 in Italy.” JAMA, 2020. Crossref, doi:10.1001/jama.2020.4683.
- Yoshida, Yilin, et al. “Clinical Characteristics and Outcomes in Women and Men Hospitalized for Coronavirus Disease 2019 in New Orleans.” Biology of Sex Differences, vol. 12, no. 1, 2021. Crossref, doi:10.1186/s13293-021-00359-2.
- Peckham, Hannah, et al. “Male Sex Identified by Global COVID-19 Meta-Analysis as a Risk Factor for Death and ITU Admission.” Nature Communications, vol. 11, no. 1, 2020. Crossref, doi:10.1038/s41467-020-19741-6.
- Guan, Wei-jie, et al. “Clinical Characteristics of Coronavirus Disease 2019 in China.” New England Journal of Medicine, vol. 382, no. 18, 2020, pp. 1708–20. Crossref, doi:10.1056/nejmoa2002032.
- Mauvais-Jarvis, Franck. “Aging, Male Sex, Obesity, and Metabolic Inflammation Create the Perfect Storm for COVID-19.” Diabetes, vol. 69, no. 9, 2020, pp. 1857–63. Crossref, doi:10.2337/dbi19-0023.
- Klein, Sabra L., et al. “Biological Sex Impacts COVID-19 Outcomes.” PLOS Pathogens, edited by Carolyn B. Coyne, vol. 16, no. 6, 2020, p. e1008570. Crossref, doi:10.1371/journal.ppat.1008570.
- Hendren, Nicholas S., et al. “Association of Body Mass Index and Age With Morbidity and Mortality in Patients Hospitalized With COVID-19.” Circulation, vol. 143, no. 2, 2021, pp. 135–44. Crossref, doi:10.1161/circulationaha.120.051936.
- Lighter, Jennifer, et al. “Obesity in Patients Younger Than 60 Years Is a Risk Factor for COVID-19 Hospital Admission.” Clinical Infectious Diseases, vol. 71, no. 15, 2020, pp. 896–97. Crossref, doi:10.1093/cid/ciaa415.
- Kompaniyets, Lyudmyla, et al. “Underlying Medical Conditions and Severe Illness Among 540,667 Adults Hospitalized With COVID-19, March 2020–March 2021.” Preventing Chronic Disease, vol. 18, 2021. Crossref, doi:10.5888/pcd18.210123.
- Ong, Sean Wei Xiang, Barnaby Edward Young, et al. “Association of Higher Body Mass Index With Severe Coronavirus Disease 2019 (COVID-19) in Younger Patients.” Clinical Infectious Diseases, vol. 71, no. 16, 2020, pp. 2300–02. Crossref, doi:10.1093/cid/ciaa548.
- Al-Salameh, Abdallah, et al. “The Association between Body Mass Index Class and Coronavirus Disease 2019 Outcomes.” International Journal of Obesity, vol. 45, no. 3, 2020, pp. 700–05. Crossref, doi:10.1038/s41366-020-00721-1.
- Lavie, Carl J., et al. “The Obesity Paradox in Infections and Implications for COVID-19.” Mayo Clinic Proceedings, vol. 96, no. 3, 2021, pp. 518–20. Crossref, doi:10.1016/j.mayocp.2021.01.014.
- Dana, Richard, et al. “Obesity and Mortality in Critically Ill COVID-19 Patients with Respiratory Failure.” International Journal of Obesity, vol. 45, no. 9, 2021, pp. 2028–37. Crossref, doi:10.1038/s41366-021-00872-9.
- Banack, Hailey R., and Jay S. Kaufman. “The ‘Obesity Paradox’ Explained.” Epidemiology, vol. 24, no. 3, 2013, pp. 461–62. Crossref, doi:10.1097/ede.0b013e31828c776c.
- Ades, Philip A., and Patrick D. Savage. “The Obesity Paradox: Perception vs Knowledge.” Mayo Clinic Proceedings, vol. 85, no. 2, 2010, pp. 112–14. Crossref, doi:10.4065/mcp.2009.0777.
- Arjun, Shiva, et al. “EVALUATING OBESITY PARADOX IN COVID 19: INSIGHTS FROM A SAFETY-NET HOSPITAL IN NEW YORK.” Chest, vol. 158, no. 4, 2020, p. A302. Crossref, doi:10.1016/j.chest.2020.08.301.
- Abumayyaleh, Mohammad, et al. “Does There Exist an Obesity Paradox in COVID-19? Insights of the International HOPE-COVID-19-Registry.” Obesity Research & Clinical Practice, vol. 15, no. 3, 2021, pp. 275–80. Crossref, doi:10.1016/j.orcp.2021.02.008.
- Huang, Huei‐Kai, et al. “The J‐shaped Relationship between Body Mass Index and Mortality in Patients with COVID ‐19: A Dose‐response Meta‐analysis.” Diabetes, Obesity and Metabolism, vol. 23, no. 7, 2021, pp. 1701–09. Crossref, doi:10.1111/dom.14382.
- Moser, Joe-Ann S., et al. “Underweight, Overweight, and Obesity as Independent Risk Factors for Hospitalization in Adults and Children from Influenza and Other Respiratory Viruses.” Influenza and Other Respiratory Viruses, vol. 13, no. 1, 2018, pp. 3–9. Crossref, doi:10.1111/irv.12618.
- Yu, Hongjie, et al. “Risk Factors for Severe Illness with 2009 Pandemic Influenza A (H1N1) Virus Infection in China.” Clinical Infectious Diseases, vol. 52, no. 4, 2011, pp. 457–65. Crossref, doi:10.1093/cid/ciq144.
- Kivimäki, Mika, et al. “Underweight as a Risk Factor for Respiratory Death in the Whitehall Cohort Study: Exploring Reverse Causality Using a 45-Year Follow-Up.” Thorax, vol. 71, no. 1, 2015, pp. 84–85. Crossref, doi:10.1136/thoraxjnl-2015-207449.
- Ni, Yue-Nan, et al. “Can Body Mass Index Predict Clinical Outcomes for Patients with Acute Lung Injury/Acute Respiratory Distress Syndrome? A Meta-Analysis.” Critical Care, vol. 21, no. 1, 2017. Crossref, doi:10.1186/s13054-017-1615-3.
- Biscarini, Simona, et al. “The Obesity Paradox: Analysis from the SMAtteo COvid-19 REgistry (SMACORE) Cohort.” Nutrition, Metabolism and Cardiovascular Diseases, vol. 30, no. 11, 2020, pp. 1920–25. Crossref, doi:10.1016/j.numecd.2020.07.047.


This Post Has 0 Comments